It’s important that your results are interpreted by the doctor or healthcare provider who requested the tests as they need to be considered in the context of all the other information available. Something can be flagged as abnormal but be perfectly OK for you in your present situation.
Here are some basic pointers to help you understand your results. Read on to learn more about:
Who prepares your test results report?
The pathology report is a medical document produced by the pathology practice that performs your tests. All pathology reports contain certain compulsory information that is essential for interpreting your results. Individual pathology laboratories often add their own information which can vary in the way it is presented.
Your tests will have been performed by scientists and/or pathologists. The pathologist-in-charge is responsible for your report. These are medical doctors who specialise in interpreting test results and observing biological changes to make a diagnosis. The pathologist is available to discuss your results with your doctor.
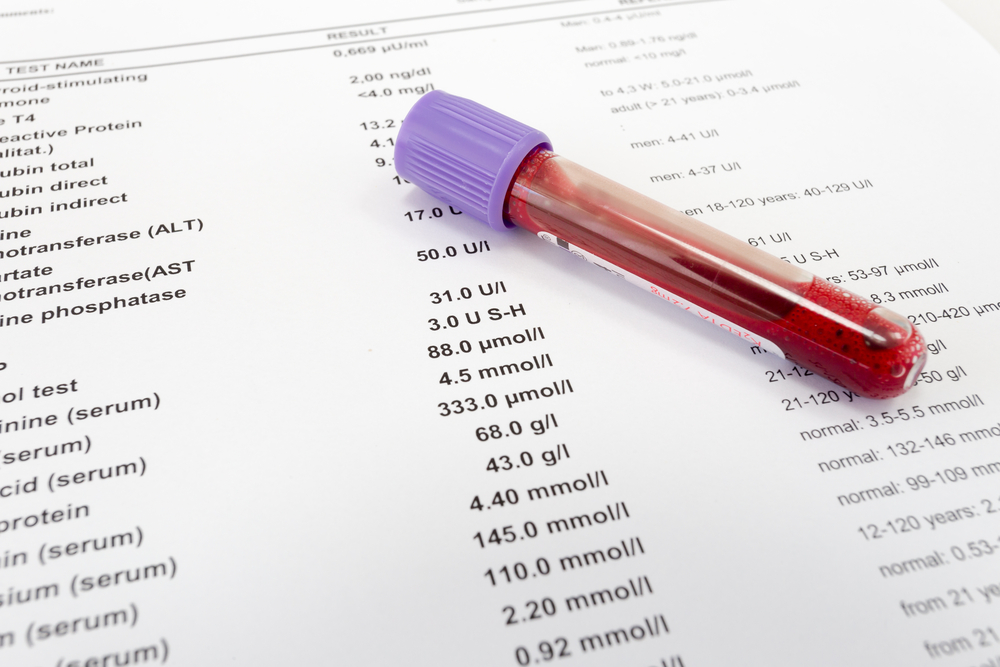
Sample reports
This is a 17-year-old girl Alicia Smith, who first came to her family doctor in mid-April 2022 complaining of very heavy periods and tiredness.

| Column 1 | The Full Blood Count measures various components in the blood. These are listed in the first column on the left. |
| Column 2 | These are the results of the first blood test that Alicia had on 15 April 2022. |
| Column 3 | These are the results from the second time Alicia had her blood tested on 18 May 2022. |
| Column 4 | This column, coloured blue, shows Alicia’s latest test results. |
| Column 5 | This shows the reference interval – the range of results that are deemed normal for the general population. Alicia’s results are compared against this to decide whether they are normal, high or low. |
| Column 6 | These are the units that are being measured by this particular laboratory |
Things to notice
The HbA1c test a blood test that is used to diagnose and monitor type 2 diabetes. It is used to show how well diabetes has been controlled over the previous few months before the blood sample is tested. This report shows the results of a 70-year old man James Smith with type 2 diabetes.

These results show changes in HbA1c at about six-monthly intervals. Abnormal results are shown in red followed with H for high. Underneath the results is information provided by the laboratory to help interpret the results.
Things to notice
The results show a steady improvement in control of the diabetes with the final HbA1c in the non-diabetic range. This final result may or may not be a good thing in this elderly man. Sometimes if treatment is too strict, blood sugar levels may fall to very low levels at times and this is potentially dangerous. The key here is communication with the doctor and diabetes educator. Target HbA1c levels should be personalised for each patient.
Take home points
Abnormal results
These sample lab reports clearly mark abnormal results by printing them in a different colour and following them with an indicator showing whether they are high (H) or low (L).
However, some labs may show them in other ways. There will always be some indicator of an abnormal result, most commonly an H for high or L for low but some labs may use other marks such as # or * signs to indicate the result is outside the reference range.
If in doubt, talk to your doctor as test results need to be interpreted in the context of all the other information available.
Reference intervals
Reference intervals, also known as reference ranges, are a way of comparing your test results with those considered normal for the general population.
It is important that you only use the reference range on the report from the lab that performed the analysis and not from any other source. This is because reference intervals can differ between laboratories for the same tests. More technical detail on reference intervals.

What is Pathology Tests Explained?
Pathology Tests Explained (PTEx) is a not-for profit group managed by a consortium of Australasian medical and scientific organisations.
With up-to-date, evidence-based information about pathology tests it is a leading trusted source for consumers.
Information is prepared and reviewed by practising pathologists and scientists and is entirely free of any commercial influence.